Lately I have been on CNN’s election night coverage, in particular interactive data visualizations for the Senate and the House.
Tag: D3
-
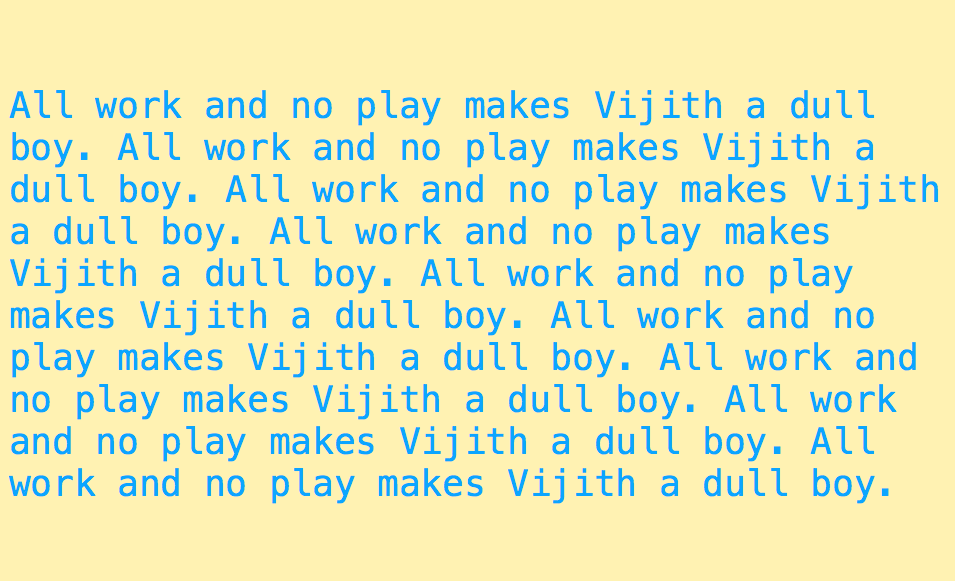
D3 Text Wrapping
It’s been more than a year since I posted it on GitHub<, so I suppose I should finally acknowledge the existence of my text wrapping plugin for D3.js. It has already been discovered by some folks (including Mike Bostock, who enthusiastically described it as “generalized somewhat.”) Gregor Aisch’s d3-jetpack also contains a simpler implementation of this feature based on counting characters instead of measuring the width of the rendered text.
-

New Yorker Projects
I’ve completely neglected to post my recent projects for The New Yorker:
- “What You Look Like to a Social Network” – essentially dumping all the data fields shared about your user accounts by the major social network APIs into a single zoomable D3 chart for chilling comparison.
- The November 7th Twitter IPO captured in an interactive infographic which lets you compare the revenues and valuations of major tech companies both against each other and against themselves over time. Written with D3, and with an unreasonable amount of attention paid to the “bounce” option among the easing function selectors.
- Mapping the failed attempts to defund Obamacare so Ryan Lizza could proceed with a characteristically astute political analysis.
- Restaurant review map, with a particularly lovely introduction by Amelia Lester.
- An interactive jQuery timeline of women in the Senate to accompany the Kristen Gillibrand profile by Evan Osnos.
- Introducing Premise, a new company that creates “offline” financial indices by having overseas workers manually enter vegetable prices into their smartphone app. Written entirely using old-fashioned journalism – no programming whatsoever!
- Breaking Bad‘s various meth money plot points in a jQuery bar chart.
- Corporate fines compared in a D3 bar chart.
- Evolution of the Dow Jones, simple mouseover effects built with jQuery.
- a number of short music items for the print issues which appeared in the anonymous critics’ notebook section under “Goings On About Town,” the event listings section.